View settings
- Using the overview window
- Filtering homology links by BLAST e-value
- Manual override of feature and label display
- Exporting the current view as an image
- Colour schemes
- Configuring other view settings
Using the overview window:
Click the overview button on the toolbar (this is a toggle button which shows/hides the overview). A separate window with a miniature version of
the main canvas will appear. When a genome is zoomed in, a slightly opaque red rectangle will be
visible on top of its representation in the overview window and this can be moved up and down with the mouse to
scroll the genome on the main canvas up and down. It also lets the user see at a glance which chromosome of the genome
is currently showing on the main canvas.
on the toolbar (this is a toggle button which shows/hides the overview). A separate window with a miniature version of
the main canvas will appear. When a genome is zoomed in, a slightly opaque red rectangle will be
visible on top of its representation in the overview window and this can be moved up and down with the mouse to
scroll the genome on the main canvas up and down. It also lets the user see at a glance which chromosome of the genome
is currently showing on the main canvas.
Back to top
Filtering homology links by score (e.g. BLAST e-value):
Using the score cut-off spinner on the toolbar, users can set a threshold for the homology score in use beyond which they will not be shown. Links will be filtered in real-time as the spinner value is changed with the up and down arrows or by entering a new value and pressing Enter.In Strudel format datasets it is expected that the score is a BLAST generated e-Value. For MAF format this is the score that accompanies each block of alignments.
Back to top
Manual override of feature and label display:
In order to control clutter on screen Strudel automatically controls when it displays features. This behaviour can be overridden by the user with the help of the "Always show all features" button which is found next to the zoom control at the bottom of the main canvas. When selected, this button
forces the permanent display of features at all times for the currently selected genome.
which is found next to the zoom control at the bottom of the main canvas. When selected, this button
forces the permanent display of features at all times for the currently selected genome.
To force the continuous display of all feature labels, right click over a chromosome and select the "Show all labels" item
from the context menu. This toggles the display of all labels for this chromosome on and off. Only one chromosome per genome can
be selected for this at any one time.
Back to top
Exporting the current view as an image:
Click on the export image button on the toolbar and a save image dialog will appear. Choose a file name and location and click the Save button
in the dialog.
button on the toolbar and a save image dialog will appear. Choose a file name and location and click the Save button
in the dialog.
Back to top
Customising the colour schemes:
Click on the customise colours button on the toolbar and the customise colours dialog will appear. You can swap between colour schemes by selecting a
scheme from the combo box. On the left you can see a list of colours and on the right you can see a preview of the
colour scheme. To customise a colour scheme, double click on the colour for the element of the scheme you wish to
change in the list and a colour chooser dialog will be displayed. Select your chosen colour, using the controls in one
of the tabs, then press the OK button. You will now see the updated preview. Once you have finished customising a
colour scheme, press the apply button to have the main view updated with the new colour scheme.
The modified colour scheme will be saved as part of your preferences automatically.
Reset to defaults in the dialog reverts a colour scheme back to its original colours.
button on the toolbar and the customise colours dialog will appear. You can swap between colour schemes by selecting a
scheme from the combo box. On the left you can see a list of colours and on the right you can see a preview of the
colour scheme. To customise a colour scheme, double click on the colour for the element of the scheme you wish to
change in the list and a colour chooser dialog will be displayed. Select your chosen colour, using the controls in one
of the tabs, then press the OK button. You will now see the updated preview. Once you have finished customising a
colour scheme, press the apply button to have the main view updated with the new colour scheme.
The modified colour scheme will be saved as part of your preferences automatically.
Reset to defaults in the dialog reverts a colour scheme back to its original colours.
The background colour scheme is normally a gradient between Background Gradient Start and Background Gradient End. To achieve a single colour background you should set both Background Gradient Start and Background Gradient End to the same colour.
Back to topConfiguring other view settings:
The configure view settings button brings up the following dialog which lets the user configure several view settings at once:
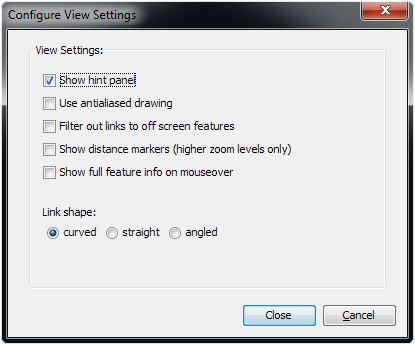
- "Show hint panel" checkbox: This can be checked to display a panel at the top of the main canvas which shows context-dependent hints on what action the user can take next.
- "Use antialiased drawing" checkbox: This lets the user toggle between antialiased and plain drawing styles for links and text drawn. Antialiased drawing produces smoother lines but comes with a significant performance overhead. Even when this button is selected, any drawing operations requiring animation therefore use the plain drawing style, with another, antialiased redraw happening shortly after the animation has stopped.
- "Filter out links to off screen features" checkbox: To reduce the number of links shown users can choose to only view those links whose features are both visible on the canvas.
- "Show distance markers" checkbox: This toggles distance markers on the chromosomes on and off (for all genomes). Please note that even when these are set to ‘on’ they will only show when a zoom level has been reached where a chromosome just fills the screen, or greater.
- "Show full feature info on mouseover" checkbox: This allows the display of all the information associated with a feature when the mouse is over it. This includes the feature name, type, position and annotation.
- "Link shape" radio buttons: Here the user can choose between curved, straight and angled link shapes.